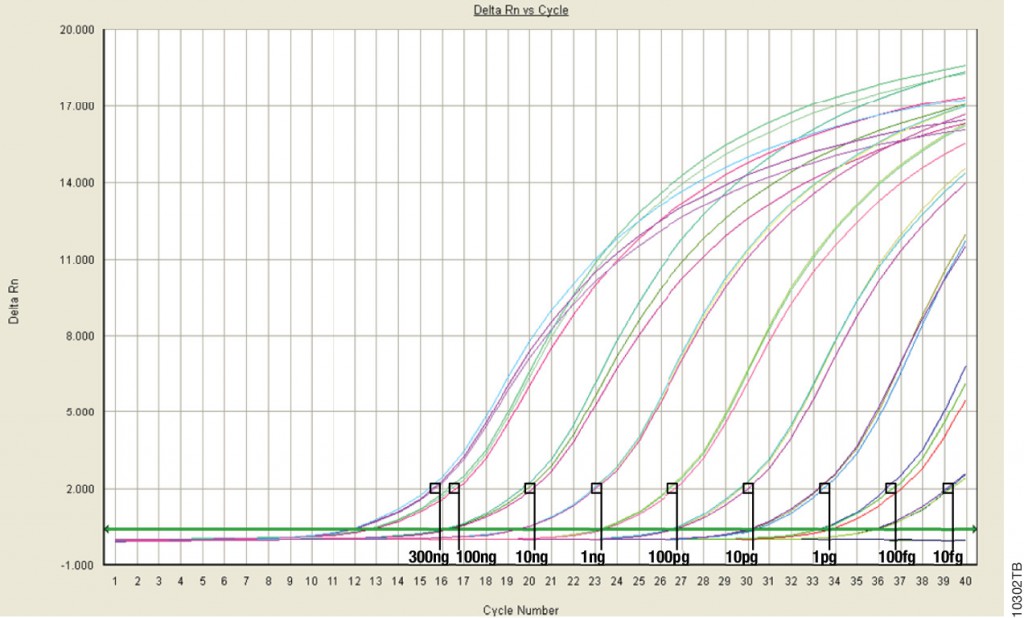
Scientists have had a love-hate relationship with PCR amplification for decades. Real-time or quantitative PCR (qPCR) can be an amazingly powerful tool, but just like traditional PCR, it can be quite frustrating. There are several parameters that can influence the success of your PCR assay. We’ve highlighted ten things to consider when trying to improve your qPCR results.
- Sample purity is crucial. Use precautions to minimize the potential for sample cross-contamination. Some practices to help with contamination problems include using aerosol resistant tips, wearing gloves and changing them frequently. Establish dedicated pre- and post-amplification areas so that you are never opening reaction tubes after amplification in the area where you will be setting up new reactions.
- Internal standards will help you have confidence in your results. Incorporating an internal standard control such as a second primer pair that amplifies a housekeeping gene with a consistent expression level in the target samples will allow you to verify the quality of the target DNA or RNA as well as the performance of the reaction components.
- Optimize! I am sorry to say that there is really no way around the fact that you will need to optimize your amplification conditions. The parameters for optimization include all the usual suspects: magnesium concentration, primer design (include the reverse transcription primers if you are doing RT-qPCR), template quality (including the possible presence of inhibitors), cycling parameters, buffer composition, enzyme concentration and including PCR additives or enhancers. (Check out this webinar for tips on optimizing qPCR and RT-qPCR!)
- Decide in advance what results you are after. With qPCR you can determine either relative or absolute quantitation of your target. Although both use the Cq (the cycle number where the amplification curve crosses the amplification threshold), there are differences. For absolute quantification, create a standard curve with known amounts of the template by plotting the Cq versus the concentration (log concentration). Using a linear regression analysis formula, you can use the Cq value of your unknown sample to determine the concentration for that sample. If you are looking for relative quantitation values, you can simply compare Cq values using the rule that for a reaction with 100% efficiency, a single template molecule will result in 2n molecules (where n is the number of cycles).
- Specificity is important, especially with fluorescent DNA-binding dyes. In addition to the optimization information described in number 3, if you are using fluorescent DNA-binding dyes you will need to test your PCR conditions to ensure that the results are producing specific product. Fluorescent dyes will not distinguish between specific and nonspecific amplification products, so you will want to have confidence in your amplification product. Moving forward you can use melting curves to verify the specificity of your PCR products.
- Primer and probe concentrations should be optimized. If you will be performing probe-based qPCR or RT-qPCR, you should optimize the primer and probe concentrations. A good place to start is 900nM for the PCR primer and 250nM for the hydrolysis probe. These are only starting points, so play around with the concentrations to see what gets the best results for your assay.

MIQE References:
- Bustin, S.A., et al. (2009) The MIQE guidelines: minimum information for publication of quantitative real-time PCR experiments. Clin. Chem. 55, 611–22.
- Bustin, S.A., et al. (2011) Primer Sequence Disclosure: A Clarification of the MIQE Guidelines, Clin. Chem. 57, 919–21.
Looking for more guidance on different types of PCR? Check out our Student Resource Center for a collection of resources related to nucleic acid amplification and other common lab techniques.
Are you looking for more in-depth information about qPCR? Check out our qPCR and RT-qPCR Guide!
We’re committed to supporting scientists who are using molecular biology to make a difference. Learn more about our qPCR Grant program.
Related Posts
Kelly Grooms
Latest posts by Kelly Grooms (see all)
- Understanding Stress Resilience in Tomatoes: Insights Into the Role of PP2C Genes - February 6, 2025
- Live-Cell Imaging: It’s Time to See What Else Your Luminescence Assays Can Tell You - December 5, 2024
- Don’t Flush Your Kitty Litter! Toxoplasmosis Is a Growing Threat to Sea Otters and Other Marine Mammals - November 12, 2024


One thoughtful comment